Difference between torque & power based remaps?

Page may contain affiliate links. Please see terms for details.

Scoops1972

Active Member
Joined
Sep 3, 2017
Messages
96
Location
Skipton, North Yorkshire
Car
W204 C250 CDI Sport
Many tuning companies now offer the choice of an economy map or a performance map. The following picture shows an example of quoted map gains.
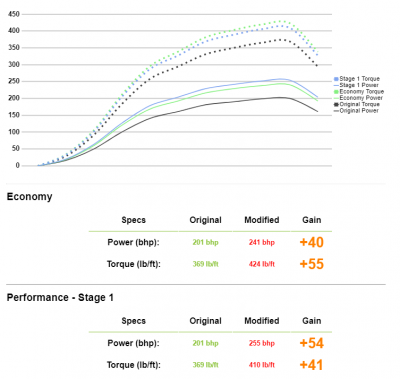
Torque or Power.png

Although the figures are for my manual gearbox C250 CDi, it's more meant as a generic question, and I'm looking for opinions on how the different gains would feel in the real world.

How would the maps be noticeable from the driver's seat under the different driving scenarios, motorways, A roads, country lanes, urban driving etc.?

Would there be a noticeable difference from standard?

Would there be a noticeable difference between the 2 remaps?

Opinions/theories welcomed :)
 
Power (bhp) defines how fast you will hit the wall, torque defines how far you will push the wall down the road
 
Many tuning companies now offer the choice of an economy map or a performance map. The following picture shows an example of quoted map gains.

Whichever company presented that graph, I'd go and ask them how the economy map gives more torque at all rpm compared to the performance map but makes less power. Does not make sense - not to me.
 
Higher torque always best as the most useable each day .

The idea with the higher torque economy map is to be able to get into the next gear sooner at a lower rpm .
 
I had my TVR remapped on a RR when I had new camshaft and injectors fitted and had also replaced the breathing system with some rather more modern and less restrictive hoses. The tuner explained I could have the power map (read higher BHP) or the driving map (read better torque spread across rev range). The car had shown 245BHP on a RR session before I did any work and came in at 265BHP afterwards, so little gain in percentage terms. However, the new map gave me 310-330LBS of torque between 1800 and 5400RPM, a significant improvement in driveability and a much smoother acceleration when really pushing on.

I could have had the BHP map and got 25-30 more BHP but having seen many TVR's boasting significant BHP figures but then sounding like you need to rev them to bits to actually get anywhere in a hurry I was glad to have the option to have a torque biased map.

OP effectively I could tell the difference (rather a lot actually) in performance and ability to get down the road but this was mostly down to a smooth and very useable torque curve than the outright BHP produced by the engine.
 
Rather simplistic but bhp tends to be st the top of the range, requiring you to rev the engine out to get the benefit, but torque tends to be much lower down, aiding general debuting and overtaking.
 
Power is simply torque times revs so I agree that the graph presented above is not real, If an engine makes more torque at a specific rpm then it must also make more power at the same RPM.
 
Power= torque times revs divided by 5252! Which is why on a two axis graph torque and power should cross at exactly 5252rpm
 
Rather simplistic but bhp tends to be st the top of the range, requiring you to rev the engine out to get the benefit, but torque tends to be much lower down, aiding general debuting and overtaking.

The rpm of maximum power will always be higher than the rpm of maximum torque - that's just the way it is.
The further those two rpm points are apart is an indication of how tractable (read useable) the engine will be to drive.

Power= torque times revs divided by 5252! Which is why on a two axis graph torque and power should cross at exactly 5252rpm

Only when the units are lb.ft and hp.
No crossover points on the posted graph - or calibration for the x-axis. Pretty sloppy.
 
The rpm of maximum power will always be higher than the rpm of maximum torque - that's just the way it is.
The further those two rpm points are apart is an indication of how tractable (read useable) the engine will be to drive.


Only when the units are lb.ft and hp.
No crossover points on the posted graph - or calibration for the x-axis. Pretty sloppy.
So I now understand that the graph is meaningless :thumb: Does that mean that the quoted gains are likely to be unrealistic or even unachievable? This was given by one of the big players in the re-mapping business, and I have to be honest, I never looked at the graph, I just looked at the quoted figures :doh:
 
When I was a lad... :D we had three profiles for camshafts: Road, Fast Road, and Race.

Road meant torque. You put your foot down and the engine picks-up the revs. You minimise gear changes because gear changes slow you down in normal driving conditions.

Race was the opposite - max power at the red line. You'd constantly work the gears to keep the engine at the very narrow rev band at the top. In fact the engine wouldn't even idle - it would cut-out if you didn't rev it a bit.

Fast Road was somewhere in between the two.
 
So if I've interpreted everyone's responses correctly, a greater increase in torque is more likely to be noticeable in every day driving conditions, than a greater increase in power?
Now I just need to get my head around the relationship between power and torque. Is it possible to increase one more than the other? When tuners quote the gains should they really state at what rpm the gains are at? I assume torque gains are greater at lower rpm and power gains greater at higher rpm? Or have I read that wrong? My brain hurts!
 
Your particular engine has more torque in proportion to bhp being a 2.1 biturbo derv .

However peak torque is early and drops early , official and alot of graphs are 1600-1800 with it dropping from 2000 .

Official and some are peak hp 4000-4200 I've even seen graphs with std and remapped to peak around 3400 - 3500 yet the stupid max rpm upchange is 4600 with an auto .

Same max rpm with manual ?
 
Last edited:
...a greater increase in torque is more likely to be noticeable in every day driving conditions, than a greater increase in power?

Correct.

...Is it possible to increase one more than the other?

A tune will increase both, but not necessarily at the same rate. Ultimately there's a trade-off between power and torque. An increase in BHP will typically be noticeable when the engine red-lines, while an increase in torque will be more noticeable when you drive the car normally. For normal driving conditions you really want an increase in torque at the expense of increase in power. So in summary both will increase but you can choose which one you want to increase the most.

...When tuners quote the gains should they really state at what rpm the gains are at? I assume torque gains are greater at lower rpm and power gains greater at higher rpm?...

Yes. Knowing the rev at which max torque and max power are achieved is paramount, but these figures alone do not tell the entire story. Look at the dyno graph - the shape of the curves is important. You want to see both power and torque starting to pick-up early-on in the rev range, and then for power have a relatively flat line (or a slow gradual upward incline) - a peaky engine is no good for day to day driving. And you want to see the torque peaking early-on in rev range. In short, the less peaky the curves are, the better.
 
Last edited:
So if I've interpreted everyone's responses correctly, a greater increase in torque is more likely to be noticeable in every day driving conditions, than a greater increase in power?
Now I just need to get my head around the relationship between power and torque. Is it possible to increase one more than the other? When tuners quote the gains should they really state at what rpm the gains are at? I assume torque gains are greater at lower rpm and power gains greater at higher rpm? Or have I read that wrong? My brain hurts!

Back to basics.
Torque is a force applied via a lever arm to a shaft causing it to tend to rotate.
Power is the above repeated such that there are more of those (forcing events) in a fixed time period.

Torque in an engine is the combustion pressure in the cylinder applying a force to the piston crown which is then transmitted via the connecting rod to the crankshaft causing it to rotate. The greater the pressure, the greater the torque.
Power increases when either the pressure in the cylinder increases or there are more of those combustion events in unit time ie, the engine turns faster.

The torque developed (for a given cylinder volume) is primarily a function of the quantity of air it can consume (breathe) as more air permits more fuel to be burned and hence greater pressure and torque. Any engine will have a ‘sweet spot’ in its rev range where the cylinder can ingest as much air as its volume permits. At lower speeds, incoming air can too easily be deflected and forced back out of the cylinder depriving it of complete filling so the combustion pressure ends up being less than it could have been and the torque suffers as a consequence.
At higher speeds the air will have insufficient time to enter the cylinder in the time available and again, incomplete cylinder filling and reduced torque is the consequence.

It is at that ‘sweet spot’ that maximum torque will be developed. Increasing the rpm above that results in progressively lower cylinder filling so while there are more combustion events, each is of a lower value. Eventually the reduced torque cannot be compensated with more rpm and the engine delivers at its maximum power.

If the cylinder filling at any engine speed is increased, torque at that speed will increase and power at that speed will also increase. If changes are made to an engine that permit it to ‘breathe’ better, then the rpm point of maximum torque will be raised (as will the power at that rpm) and the point at which the cylinder filling efficiency drops off will also be raised and thus the rpm at which maximum power occurs will also be higher. The power will be higher as the cylinder is still filling well and doing so more often (in unit time). A consequence of raising the rpm point of maximum torque though is that at lower rpm the ‘back flowing’ increases lessening the cylinder’s ability to fill and thus reducing its combustion pressure and hence torque. Such an engine can feel gutless at low speed, pulling progressively harder as it homes in on its new, higher rpm power peak.
The engines torque level is no higher than before, but because it is at a higher rpm, there are more of those combustion events and hence the power output is greater than before.

The above is easier understood in the context of a naturally aspirated engine. For turbo diesels the cylinder filling is largely governed by the turbocharger size and as a diesel generally consumes more air than it is provided with fuel to consume all of the oxygen in the air, the turbo diesel is ‘tuned’ by increasing boost level (more air, better cylinder filling) and increasing fuel supplied (per combustion event) to get the benefit of the increased air supply and to utilise more of the oxygen. Further tuning employs a larger turbocharger for enhanced air supply at higher rpm but at lower rpm the air supply is reduced (sometimes drastically) and due to other diesel constraints, the effect of pushing the rpm of maximum power point upwards is less successful thus the power tends to be cropped at the bottom of the range, come on in a rush as a large turbo finally spins up then runs out of puff when the inherent breathing restrictions kick in. Such an engine can be ‘peaky’ and difficult to drive.

A very course summary likens torque to the ‘bang’ in the cylinder and power to how many of those ‘bangs’.
As power is torque multiplied by rpm (bang multiplied by frequency of bangs) it is obvious that any particular hp output can be derived from a wide range of torque X rpm combinations.
 
Wow!!! You guys rock :rock:

Thanks to everyone for taking the time and effort to explain this to me, I think I finally understand :thumb: (Helped with a refreshed brain this morning)

I was Googling correct power and torque graphs at 7am this morning to see if I could make any more sense of the comments, and I'm going to try and plot the quoted figures on a 3 axis graph to see if it looks more like it should. (As long as I don't get caught by my boss ;)) Just realised I can't do this as the graph doesn't show the rpm! :wallbash:

Thanks again everyone, a huge help :D

And just some extra smilies for good measure :confused::p:eek::oops:o_O
 
Last edited:
Your particular engine has more torque in proportion to bhp being a 2.1 biturbo derv .

However peak torque is early and drops early , official and alot of graphs are 1600-1800 with it dropping from 2000 .

Official and some are peak hp 4000-4200 I've even seen graphs with std and remapped to peak around 3400 - 3500 yet the stupid max rpm upchange is 4600 with an auto .

Same max rpm with manual ?

The rev counter shows red line around that figure, but I don't know if that's the official limit. I know the car feels to pull hard all the way upto and even into the red :dk:
 
The rev limiter would *typicaly* be set to where the red area starts, though not always...

It is important to know what is the quoted rpm at which peak bhp is achieved, because there's no point in revving the engine beyond that point.
 
The rpm of maximum power will always be higher than the rpm of maximum torque - that's just the way it is.
The further those two rpm points are apart is an indication of how tractable (read useable) the engine will be to drive.


Only when the units are lb.ft and hp.
No crossover points on the posted graph - or calibration for the x-axis. Pretty sloppy.

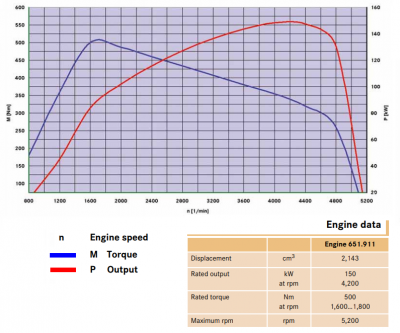
Ok, you got me curious enough to have a look at what a good/correct/expected power and torque graph should look like.

I came across a Mercedes brochure whilst searching the internet, and the following graph is for what i believe to be my engine.

Power curve.png
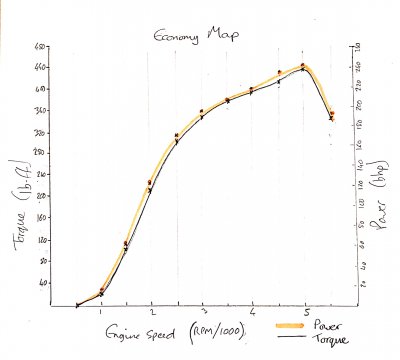
So I decided to use the figures from the graph i was supplied by the remap company and create my own.

I used the Economy map figures, when in hindsight I should have used the standard map figures. I didn't bother converting to Nm or kW, as I was just looking more for the shape of the curves for torque and power.

I estimated the RPM as the supplied graph didn't state this, and it appears that I was around 500 rpm too great when I've labelled my axis, but again, the shape of the curves should be reasonable.

Apologies in advance for the very crude graph, but this was drawn on the back of a work document during my coffee break, and was just to get a basic idea of the curve shapes.

Economy map.jpg

So my conclusion from this is that the power curve quoted by the remap company is possibly correct for my vehicle, but the torque curve certainly isn't, and in fact just appears to be identical to the power curve?!

A customer care representative from the remap company contacted me yesterday regarding their quote, and I have advised them that I am currently seeking help interpreting their claims, as the graph they had supplied wasn't in a format that I was familiar with. I don't expect that I will hear from them again.

The question is now, do I still trust in what I believed to be a highly regarded remapping company and consider one of their remaps?
Or walk away being thankful that I had the help of you guys, and feel glad that I didn't spend my money with them?
 

Users who are viewing this thread

Back
Top Bottom