E350Cdi Stage 1 Remap Dyno Variation vs Stock

Page may contain affiliate links. Please see terms for details.

MrGundam

Active Member
Joined
Jan 30, 2021
Messages
170
Location
Hampshire
Car
2012 C207 E350Cdi
Hey everyone,

I came across this printout of a dyno on a Facebook group, apparently for a E350Cdi 265bhp but I was a bit confused by the torque so questioned it.

At stock I thought the torque for a E350Cdi 265bhp was 620Nm but on the readout it shows stock as 512Nm and 625Nm after. Is the published torque not at the wheel or something?

The Bhp looks right at stock (265Bhp) so confused why torque is so different.

DQwERad.jpg


The tune itself looks impressive, if true... with Bhp from 265 to 333 and Torque from 512Nm to 625Nm.
 
Last edited:
There is something wrong with the torque output of that car .

They usually read no lower than 590 Nm and can go as high as 750 Nm with most getting well over 700 Nm .
 
There is something wrong with the torque output of that car .

They usually read no lower than 590 Nm and can go as high as 750 Nm with most getting well over 700 Nm .
I thought that but then the bhp looked on point. What can effect torque output?
 
Do diesel dyno graphs cross over at a different point to petrol ones?

On petrol dyno graphs the torque and BHP curves cross over each other at 5,252rpm due to the way the calculations are done.
 
Do diesel dyno graphs cross over at a different point to petrol ones?

On petrol dyno graphs the torque and BHP curves cross over each other at 5,252rpm due to the way the calculations are done.
I was a bit confused by that. I was under the impression that Bhp is a direct calculation of RPM and torque, so it's strange to see a correct stock Bhp but low torque for the given rpm?
 
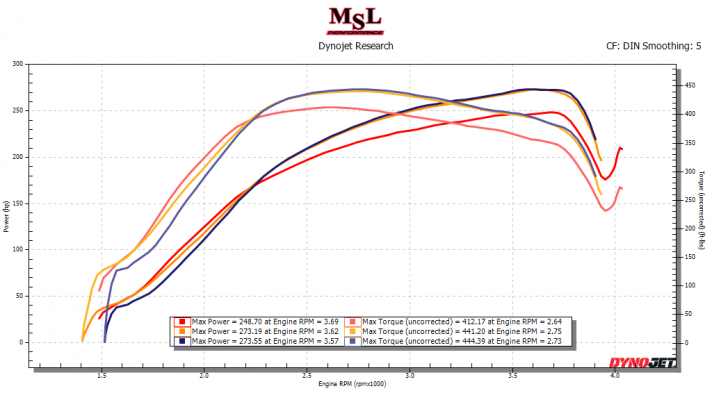
Possibly the bhp has been corrected for transmission losses but the torque has not? The MSL/BIg Fish tune on my 350 gave uncorrected figures of 273 bhp and 444 lb ft, which is 322 bhp and 530 lb ft corrected. The chart (£20 from MSL - I have it now) didn't come with the car, so before purchase I rang Big Fish, and was told those figures were perfectly achievable.

Mind you, 530 lb ft is 719 nm, so the torque is still lacking quite a lot. Also, according to my dyno chart the fun's all over by 3800 rpm, after which torque and power are dropping quite steeply - much more so than on that chart. If it's correct, the useful rev range has been extended by about 10% at the expense of a flatter and lower max torque curve lower down the rev range. I'd love to drive that car to see how it felt; a bit more like a petrol car, perhaps.

Dyno Dynamics is an Australian company; maybe it's just a spoof to confuse the Poms... :D It could be down to the skill of the dyno operator and the accuracy of the dyno, of course.
 
Last edited:
Do diesel dyno graphs cross over at a different point to petrol ones?

On petrol dyno graphs the torque and BHP curves cross over each other at 5,252rpm due to the way the calculations are done.
For any engine the traces cross at 5250rpm - when the units are both in imperial ie, lbs.ft and hp.
It's the obsession with quoting torque in N.m chasing the larger number that has corrupted this very useful aspect.
 
For any engine the traces cross at 5250rpm - when the units are both in imperial ie, lbs.ft and hp.
It's the obsession with quoting torque in N.m chasing the larger number that has corrupted this very useful aspect.
The OM642 doesn't rev to 5250 rpm. I'll have a look at the crossing point later when I get home. The traces are in Imperial measurements.
 
The OM642 doesn't rev to 5250 rpm. I'll have a look at the crossing point later when I get home. The traces are in Imperial measurements.
If it doesn't go to 5250rm there'll be no crossover of traces. Doesn't matter though as it's still showing the nature of the engine's delivery.
 
Actually, they do cross, at 3200 rpm for both tunes. (Unknown to the owner, the ECU had been remapped already; the red traces are the tune that was on the car when it went in to MSL, the orange and blue MSL's two runs).

Y13DGC CLS350 STAGE1 DYNO GRAPH.png
 
Actually, they do cross, at 3200 rpm for both tunes. (Unknown to the owner, the ECU had been remapped already; the red traces are the tune that was on the car when it went in to MSL, the orange and blue MSL's two runs).

View attachment 111297
Only cross because the torque and power on the Y axis are calibrated differently.
 
I have to ask how, and why. The way the values are depicted on both those dyno charts is very clear, easily understood and presumably accurate, so what is the purpose of a different way of showing it?
 
I have to ask how, and why. The way the values are depicted on both those dyno charts is very clear, easily understood and presumably accurate, so what is the purpose of a different way of showing it?
Principally, by using the same scales there's consistency (standardisation) that makes comparisons of graphs from different engines a lot easier to read. Once the calibrations vary it's at the whim of whoever and that aspect has to be deciphered.

Plot your curves with Y axis calibrations for torque and power on the same scale and you will see how much better it displays the engine's nature.
 
I can't visualise it any differently, I'm afraid. I can't see how, if the torque and power curves cross on an engine at 3200 rpm, you could reasonably display them without a crossover point. Do you have an example you could post so we could see?
 
I can't visualise it any differently, I'm afraid. I can't see how, if the torque and power curves cross on an engine at 3200 rpm, you could reasonably display them without a crossover point.
The right-hand scale (for torque) is scaled from zero to 490, while the left-hand scale (for power) is scaled zero to 300. If the power plot was on the same scale as the torque plot, they wouldn't cross.
 
OK, now I get it. The power and torque values are correct, so at 3200 rpm the torque curve is falling and the power curve is still rising; the 'cross' is only in the way they're displayed.
 
So does anyone know why / how a car can deliver the correct spec Bhp but have such low torque values?
 
Well this is getting confusing! I had our ML350 W166 remapped a few years ago by BFT/MSL and got the following results. The initial RR showed output of 277 from factory oppose to the 265 quoted, so my gains were not as much as expected, as I was quoted it should be approx 303 when finished.
 

Attachments

  • ML350 277.7bhp tuned to 303.3bhp.pdf
    130.5 KB · Views: 17

Users who are viewing this thread

Back
Top Bottom