or perhaps an alternative to having to let real bodies pile up in order to for the issue to be taken seriously by the wider majority?to me, this is scaremongering
Navigation
Install the app
How to install the app on iOS
Follow along with the video below to see how to install our site as a web app on your home screen.
Note: This feature may not be available in some browsers.
More options
You are using an out of date browser. It may not display this or other websites correctly.
You should upgrade or use an alternative browser.
You should upgrade or use an alternative browser.
Covid-19 Discussion
- Thread starter Big Janner
- Start date
Page may contain affiliate links. Please see terms for details.
- Status
- Not open for further replies.
- Joined
- Jun 24, 2008
- Messages
- 45,604
- Location
- London
- Car
- 2022 Hyundai IONIQ 5 RWD / 2016 Suzuki Vitara AWD
to me, this is scaremongering
I agree (on the assumption that the lower figure was in fact low, because obviously if it was also a very high one then my point becomes irrelevant).
If this is indeed the case, then what I would say is that while I do empathise with the frustration among medical experts with the low level of compliance in some parts of society, it does not justify not telling the British public the truth, the whole truth, and nothing but the truth.
Apart from the obvious moral and ethical issues that it presents, doing so is also counter-productive, because it erodes public trust.
The same, BTW, happened to President Trump after admitting in a TV interview that he deliberately played-down the severity of COVID-19 because he "didn't want to create panic". The majority of people now no longer believe anything he says about COVID-19. We don't want to find ourselves in the same situation in the UK.
The graph shows the worst case scenario (purple) on 1st Nov to be 1000 deaths which was then extrapolated to the 4000 deaths by 2nd week in December. Actual reported deaths were, I think, about 160.It may be balanced, but is it as misleading as everything else we see and hear now? For instance I fail to understand this bit (which could be because I’m thick of course!)
View attachment 104361
Looking at that graph for today’s date shows even the highest prediction at around 250 to 300 deaths, which Mr Triggle says is the current average. I also dislike his use of the words “by now there should be 1000 deaths a day”. These are forecasts and no more than that, nobody said it was compulsory to have a certain number of deaths by a certain time.
D
Deleted member 37751
Guest
Hopefully the message is starting to get through that lumping those vulnerable to Covid in with those with a 0.00001% of dying is crazy:An uncharacteristically balanced piece from the BBC on the impending second lockdown:
Perhaps the balance is a result of having someone who specialises in health matters (Nick Triggle) and is clearly knowledgeable about the subject matter write the article rather than a political correspondent?
Covid: The things we’re not being told as lockdown looms
Ministers say lockdown needed, but some questions remain unanswered as MPs get ready for key vote.www.bbc.co.uk
Why has more not been done to protect the vulnerable?
We know the virus has killed a disproportionate number of people who are either elderly or have an underlying health condition.
Yet as the second wave has taken off, the number of outbreaks linked to care homes has started increasing, while one in five of the "new hospital cases" are actually people thought to have caught the virus in hospital.
This is a source of frustration for many experts.
Research shows that three-quarters of deaths in the first wave came from just 5% of the population judged to be at highest risk, according to modelling by Oxford University.
This 5% will include people in care homes and those sick enough to be in hospital for other conditions.
Prof Mark Woolhouse, an infectious diseases expert at Edinburgh University, says he cannot understand why more is not being done alongside the social distancing rules already in place to protect such groups.
It could, he believes, "make a significant difference" to the number of deaths. "It's unconscionable we are not doing more."
What could be done?
A range of different suggestions have been put forward to government.
These include supporting multi-generational households by offering free hotel accommodation, boosting the care home workforce so staff do not need to work across multiple homes making it easier for infections to spread, and providing more testing to hospital staff and also those who having caring responsibilities.
- Joined
- Nov 6, 2007
- Messages
- 12,859
- Location
- North Oxfordshire
- Car
- His - Denim Blue A220 AMG Line Premium / Hers - Obsidian Black R172 SLK55
I fear we're already thereWe don't want to find ourselves in the same situation in the UK.

Hopefully the message is starting to get through that lumping those vulnerable to Covid in with those with a 0.00001% of dying is crazy:
My good lady is a deputy registrar and since March has only seen 1 death instance where Covid is the only illness that appears on the death certificate, all the rest have other conditions mentioned as well as Covid
The problem is, these people are effectively carrying our risk assessments, which is a job I did in the past. Unfortunately when doing these, you must always state worst case senario. For example, when working at height, worst case senario is always death, but in my 40+ years doing this job, never had one fatality, but I agree, they should also state the lowest risk as well as the highest risk.to me, this is scaremongering
D
Deleted member 150136
Guest
I bought my motorbike of a funeral director, he said only 2 of his customers were associated with covid....since March.
The hospitals are 80% full.
People are saying will the last 20% cope with the 2nd wave, surely the 80% will fluctuate as people are released from hospital once they are OK?
We won't just have 20% capacity free and diminishing?
The hospitals are 80% full.
People are saying will the last 20% cope with the 2nd wave, surely the 80% will fluctuate as people are released from hospital once they are OK?
We won't just have 20% capacity free and diminishing?
I wonder whether CV19 admissions figures are counted on a similar basis as deaths.
everyone being admitted to hospital is tested for CV19. So, if someone is admitted as a result of a car crash and tests positive but has no CV19 symptoms, is that still counted as a CV19 admission?
everyone being admitted to hospital is tested for CV19. So, if someone is admitted as a result of a car crash and tests positive but has no CV19 symptoms, is that still counted as a CV19 admission?
- Joined
- Jun 24, 2008
- Messages
- 45,604
- Location
- London
- Car
- 2022 Hyundai IONIQ 5 RWD / 2016 Suzuki Vitara AWD
I wonder whether CV19 admissions figures are counted on a similar basis as deaths.
everyone being admitted to hospital is tested for CV19. So, if someone is admitted as a result of a car crash and tests positive but has no CV19 symptoms, is that still counted as a CV19 admission?
There are two factors at play here.
The first factor is simply (and indisputably) the numbers of daily hospital admissions and bed occupancy. The projection from the current trend will tell us with a reasonable degree of accuracy how soon before then NHS is overwhelmed and runs out of capacity.
The second factor is the number of hospital admissions due to COVID-19. And by 'due to', we mean to say that if the patient did not have a diagnosis of COVID-19, they would not have been admitted to hospital (e.g. an asthmatic person who might have not been admitted if he or she didn't also have COVID-19, etc). This figure is less accurate and more subjective.
The point is that the first factor can be mitigated by increasing NHS capacity, which isn't a simple task, even when taking into account the Nightingales set-up by the Army.
The second factor can be mitigated by reducing the spread of COVID-19 in the population, i.e. by imposing restrictions and lockdown etc.
But the bottom line is that saying that our hospitals ran out of beds but 'it wasn't due to COVID-19' isn't going to be an acceptable excuse, when all the data we have to hand is showing us that this is coming if we take no action to mitigate it.
NHS England says bed occupancy is about the same or lower compared to the same time last year.
not sure where you got “due to” from. See extracts from gov.uk below:
Total number of patients admitted to hospital with COVID-19.
Data are not reported by each nation every day and Scotland's data are only published weekly. The definitions are not consistent between the four nations (see below).
England
England data include people admitted to hospital who tested positive for COVID-19 in the 14 days prior to admission, and those who tested positive in hospital after admission. Inpatients diagnosed with COVID-19 after admission are reported as being admitted on the day prior to their diagnosis.ChipChop
MB Enthusiast
This CEBM page has graphs for absolute changes in hospital admissions which demonstrates the massive fluctuations in admissions due to factors such as death of patients (a known figure) and discharging of those admitted who are found not to need hospital treatment. There must be a lot of these cases with people being scared stiff by the media project fear stories and also GP's reluctance to see patients face to face so a telephone diagnosis and a referral to hospital which turns out to be incorrect upon admission.People are saying will the last 20% cope with the 2nd wave, surely the 80% will fluctuate as people are released from hospital once they are OK?
We won't just have 20% capacity free and diminishing?
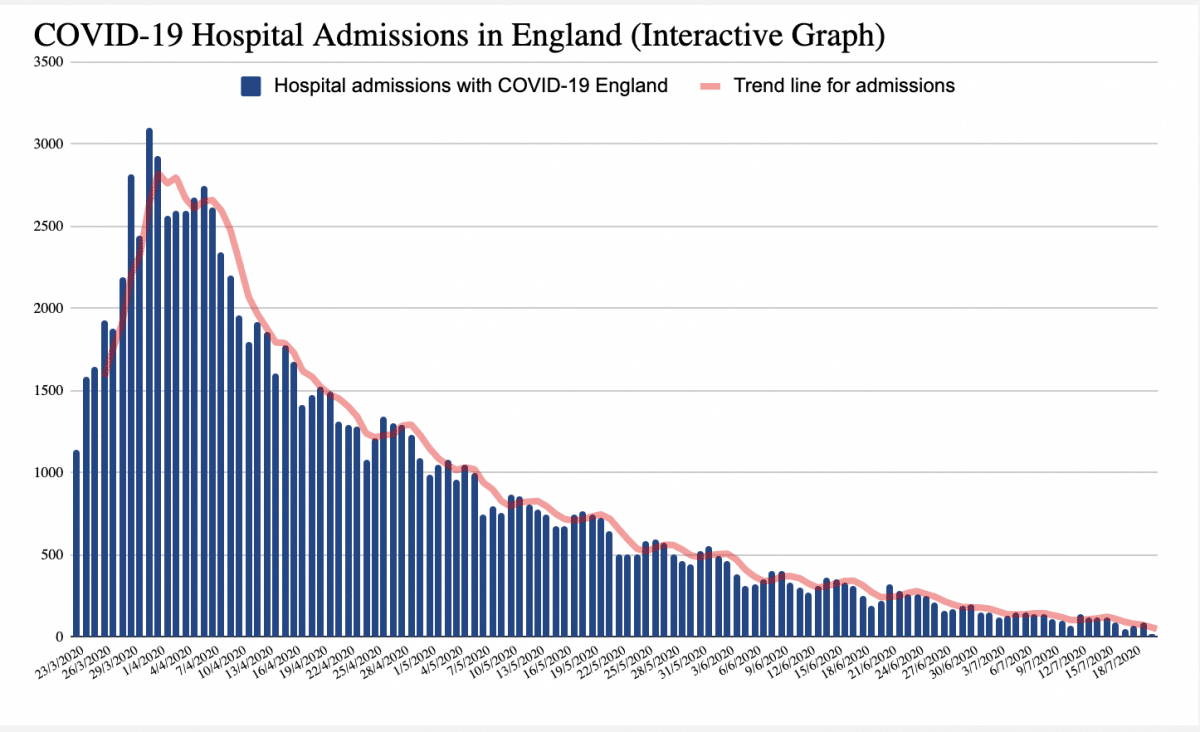
COVID-19: Admissions to Hospital - Update - The Centre for Evidence-Based Medicine
Overview of data on hospital admissions with COVID-19 in the UK and care home cases of COVID-19 in England.
 www.cebm.net
Last edited:
What is also not clear, is that even if we accept that the current occupancy is 80% (and setting aside the fact that national average is irrelevant for any single hospital that runs out of beds), how is this seen as not being in line with the government's decisions?
All the graphs we saw clearly showed an upward trend where hospital admissions are on the rise. So how will the current 20% capacity be able to cope with the anticipated rapid increase in demand?
As we are on a motoring forum... the prudent driver will pull into Motorway services and fill-up shortly after the reserve fuel warning light comes on. A less responsible driver might wait until the engine stalls and then rely on the AA Patrolman for a rescue....
..... or he may have a spare couple of gallons in his Nightingale jerrycan designed for emergencies?
The problem is, these people are effectively carrying our risk assessments, which is a job I did in the past. Unfortunately when doing these, you must always state worst case senario. For example, when working at height, worst case senario is always death, but in my 40+ years doing this job, never had one fatality, but I agree, they should also state the lowest risk as well as the highest risk.
my issue is that risk assessment is not accompanied by any meaningful explanation of the likelihood of the worst case scenarios, including the reasons for the analysis
these numbers are presented as if the data, analysis and assumptions are rock solid
- Joined
- Nov 6, 2007
- Messages
- 12,859
- Location
- North Oxfordshire
- Car
- His - Denim Blue A220 AMG Line Premium / Hers - Obsidian Black R172 SLK55
In deference to the rule regarding keeping politics out of this thread (somewhat difficult when you need to discuss actions that are being imposed by our politicians in response to Covid-19), I've made a post in the UK Politics thread regarding an unexpected speech in parliament today in which the point was made that “For many people it looks as if the figures are chosen to support the policy rather than the policy being based on the figures.”
D
Deleted member 149005
Guest
I bought my motorbike of a funeral director, he said only 2 of his customers were associated with covid....since March.
The hospitals are 80% full.
People are saying will the last 20% cope with the 2nd wave, surely the 80% will fluctuate as people are released from hospital once they are OK?
We won't just have 20% capacity free and diminishing?
how many of his customer rode motorbikes?
D
Deleted member 150136
Guest
how many of his customer rode motorbikes?
None, anymore.
In deference to the rule regarding keeping politics out of this thread (somewhat difficult when you need to discuss actions that are being imposed by our politicians in response to Covid-19), I've made a post in the UK Politics thread regarding an unexpected speech in parliament today in which the point was made that “For many people it looks as if the figures are chosen to support the policy rather than the policy being based on the figures.”
Thank you for linking/posting in the Politics thread
D
Deleted member 65149
Guest
What a plonker I am. I misread the X-axis labels as September 20th, November 20th and didn’t look any furtherThe graph shows the worst case scenario (purple) on 1st Nov to be 1000 deaths which was then extrapolated to the 4000 deaths by 2nd week in December. Actual reported deaths were, I think, about 160.

Dryce
Hardcore MB Enthusiast
- Joined
- May 17, 2006
- Messages
- 10,964
- Car
- ..
There are two factors at play here.
There's a third factor - which is about attitude and influence.
If I tell you that your house probably needs fixing up or it may be damaged if there is a storm then chancs are you won't hurry to fix our house.
If I tell you that your house needs fxing and that there is a storm coming and that it is going to get severelyy damaged then maybe you hurry to fix your house.
The truth as such may be that your house has some wear and tear that means there's a one six chance that in the nxt 5 years there will be storm bad enough that it will be damaged. The actual extent of the damage may vary.
The government is faced with something similar. I think they are erring on the side of the second version because they don't trust giving us the first or third version.
And I have some sympathy with this.
Personally if I was in charge I might go with the same policy. But. I'd lay it out differently. I'd spend more time communicating and explaining the position rather than doing what they did on Saturday which was to lay out the second version with some hope in front of a smug and self-justifying media that was revelling in having bounced them into showing their hand hours or days earlier than they wanted.
- Status
- Not open for further replies.
Users who are viewing this thread
Total: 2 (members: 0, guests: 2)
Share: